- Economic
- Agriculture
- Construction
- Finance
- Labor
- Employment to Population Ratio
- Female Employment to Population Ratio
- Female Labor Force Participation
- Female Unemployment Rate
- Labor Force Participation Rate
- Male Employment to Population Ratio
- Male Labor Force Participation Rate
- Male Unemployment Rate
- Not in Education, Emoloyment, or Training
- Unemployment Rate
- Working Student
- Macroeconomics
- Manufacturing
- Mining
- Services
- Trade and Hospitality
- Transportation and Communication
- Utilities
- Environmental
- Social
- Semua Data

Interval
Kustom Waktu
Satuan
Interval
Kustom Waktu
Dari
Sampai
Satuan
Utilities Labor Income Relative to Value Added
Utilities Labor Income Relative to Value Added
NA
Utilities Labor Income Relative to Value Added
| Provinsi | Pct laborincome_va_utilities |
|---|
Sumber Data
Utilities Labor Income Relative to Value Added
Sumber Data
:
Indonesia's Input-Output Table (BPS), processed by LPEM FEB UI
Terakhir diperbaharui
:
12 Desember 2021
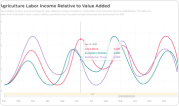
Value added, output, and percentage of value added to output is based on Indonesia's nine economic sectors classification. The data are taken from Indonesia's Input-Output Tables, published every five years using producer prices dating back to 1995.
Unduh
Grafik
Utilities Labor Income Relative to Value Added
Satuan :
Interval : undefinedly -
NA
Utilities Labor Income Relative to Value Added
Satuan :
Interval : Tahunan